跳到正文
Simon Willison 博客·· 3 小时前AI 评分34

用 Parseable 与 Datasette 处理 OpenTelemetry traces

Using Parseable with Datasette for OpenTelemetry traces

AI 导读

Simon Willison 用 Codex 摸索出如何运行 Parseable 并接收来自 Datasette 的 OpenTelemetry traces。

正文

TIL: Using Parseable with Datasette for OpenTelemetry traces

I saw Parseable in a Show HN today - it's a new observability platform with both an open source (AGPL) Rust implementation (a single ~180MB binary), an "Enterprise" version with extra features and a cloud hosted option.

Since Datasette 1.0a41 added OpenTelemetry support (thanks, Alex Garcia), I decided to fire up Codex and have it figure out how to run Parseable and feed it traces from Datasette.

Here's my (human-written) TIL showing the patterns that worked, and here's a screenshot of a Datasette trace displayed within the Parseable localhost web application:
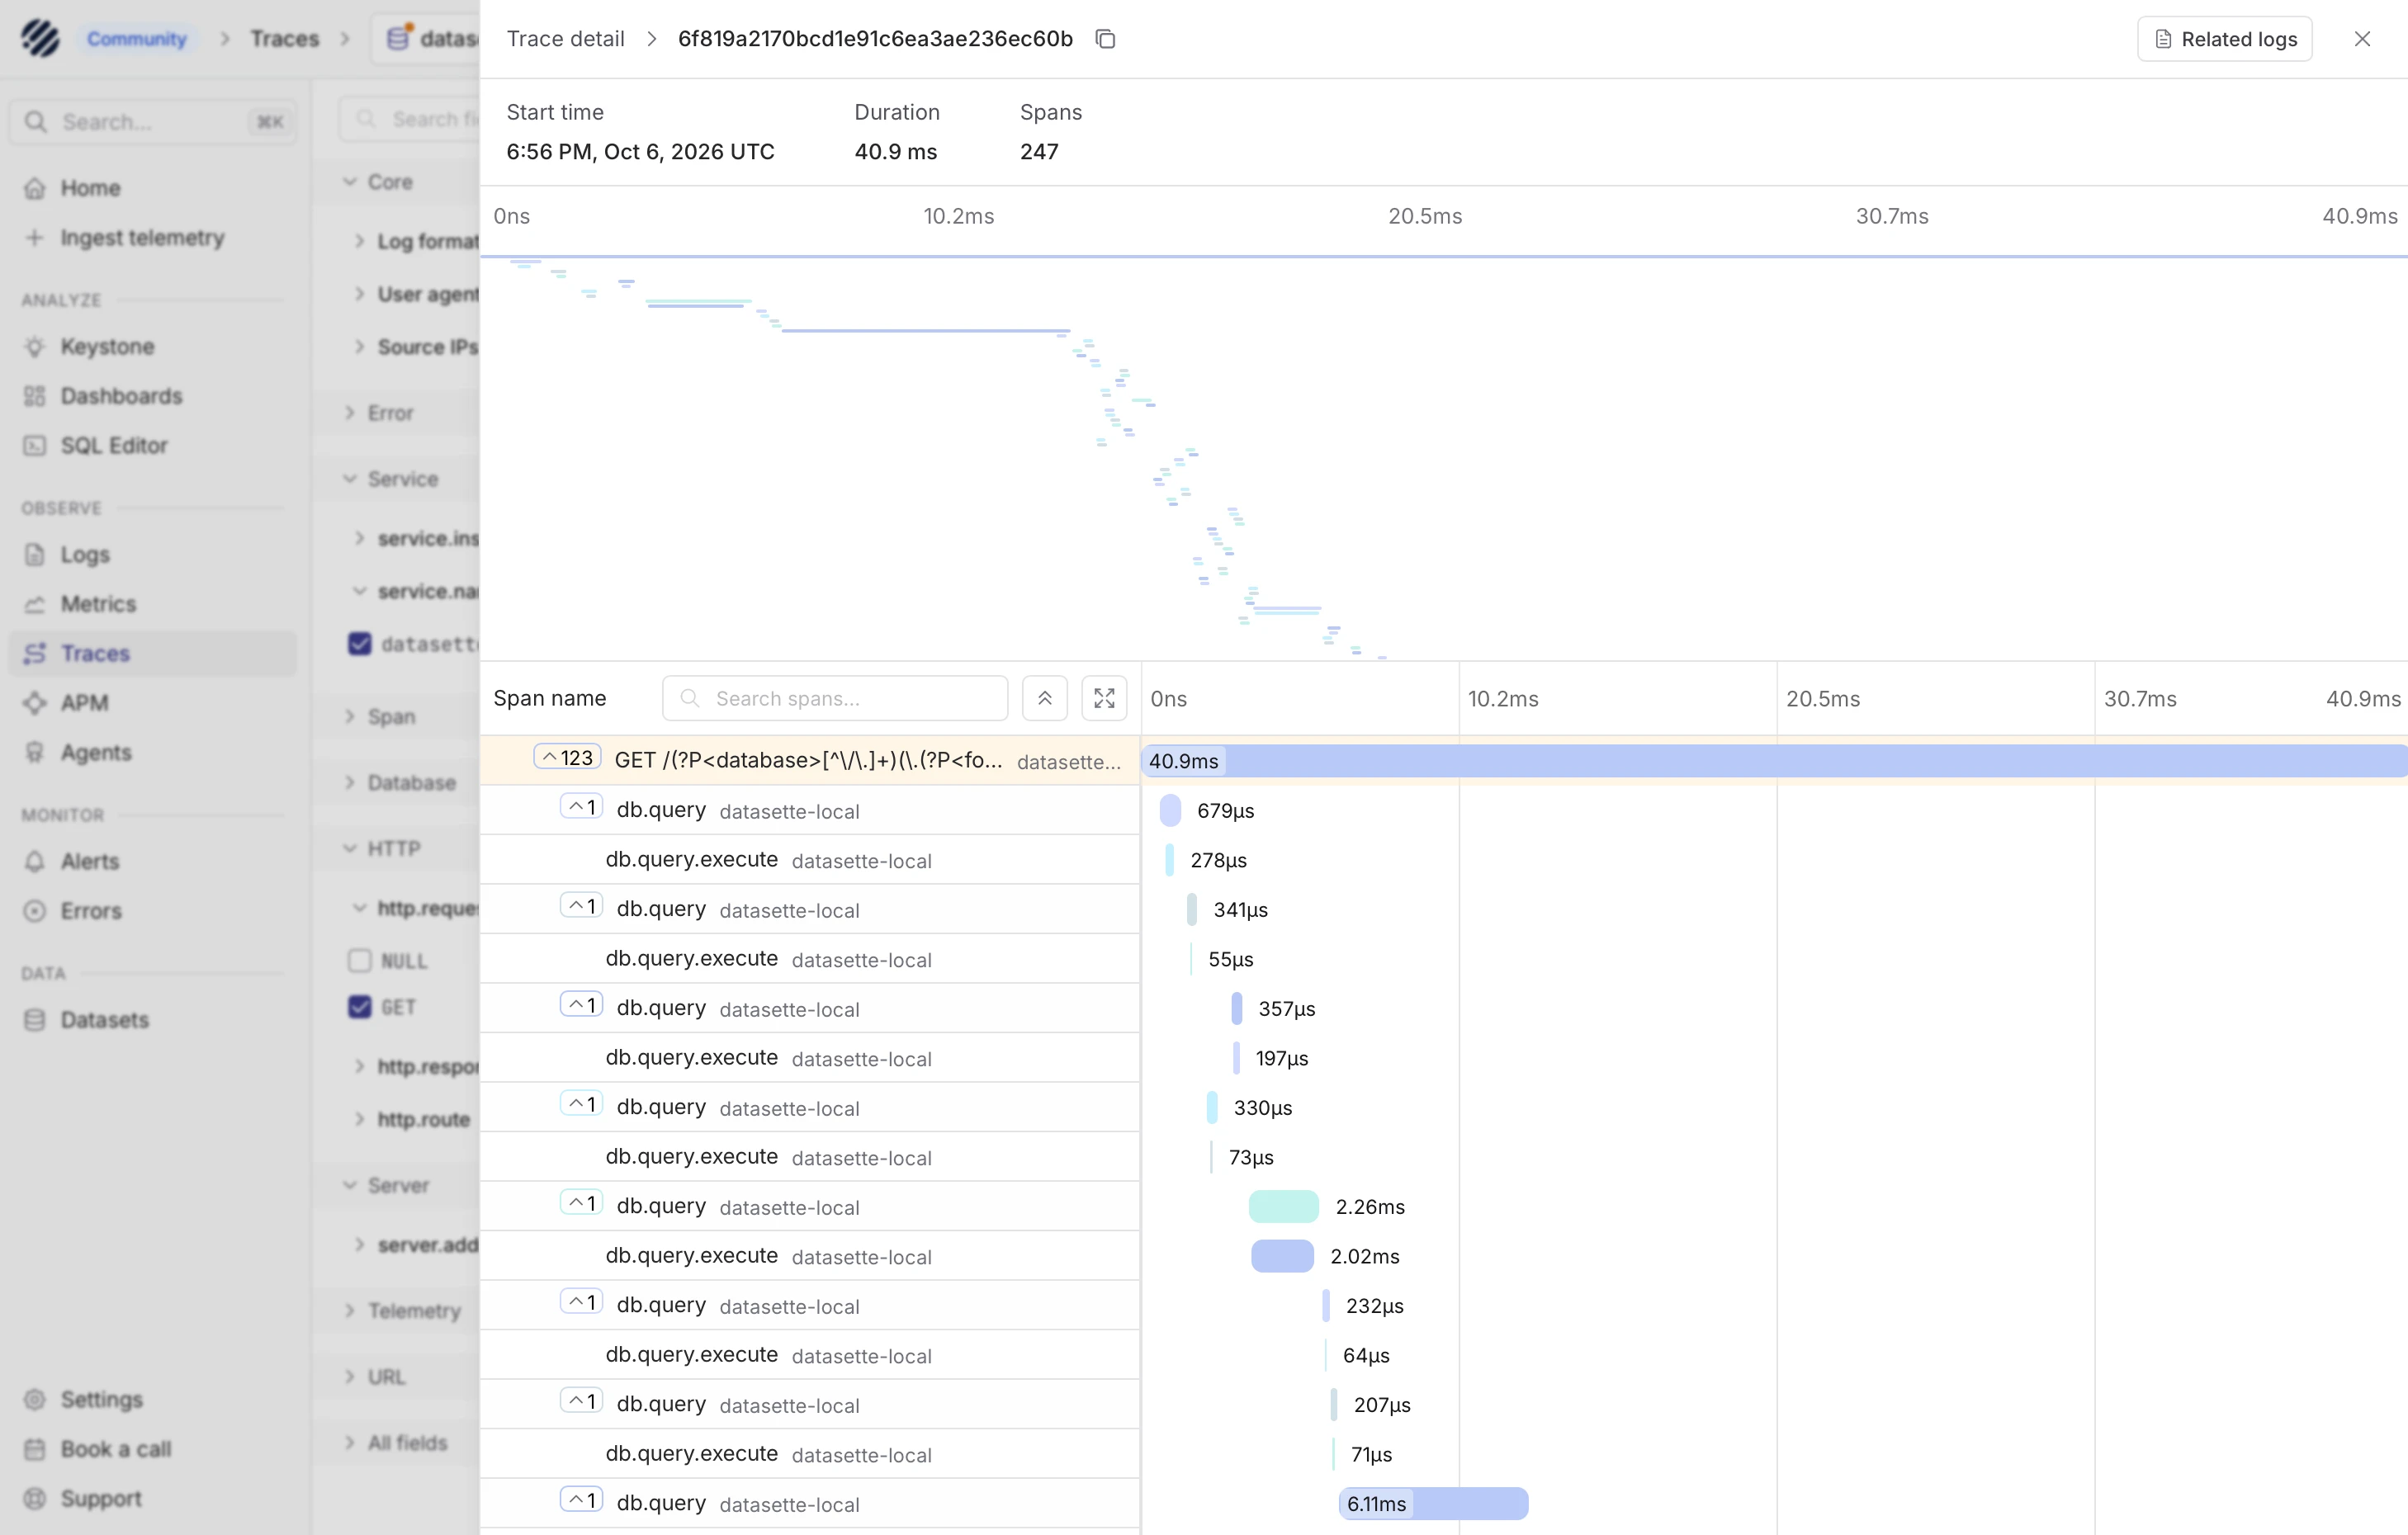
Screenshot of a trace detail view in an observability web app, with a span waterfall overlaid on a dimmed navigation sidebar and filter column. Dimmed sidebar: breadcrumb "Community > Traces > datas" (cut off), search box "Search... ⌘K", nav items "Home", "Ingest telemetry", section "ANALYZE": "Keystone", "Dashboards", "SQL Editor", section "OBSERVE": "Logs", "Metrics", "Traces" (selected), "APM", "Agents", section "MONITOR": "Alerts", "Errors", section "DATA": "Datasets", and at the bottom "Settings", "Book a call", "Support". Dimmed filter column, cut off at the right edge: "Search fi", "Core", "Log format", "User agent", "Source IPs", "Error", "Service", "service.ins", "service.na", "datasett" (checked), "Span", "Database", "HTTP", "http.reque", "NULL" (unchecked), "GET" (checked), "http.respo", "http.route", "Server", "server.add", "Telemetry", "URL", "All fields". Trace panel header: "Trace detail > 6f819a2170bcd1e91c6ea3ae236ec60b" with a copy icon, a "Related logs" button and a close X. Summary: "Start time 6:56 PM, Oct 6, 2026 UTC", "Duration 40.9 ms", "Spans 247". A minimap with axis "0ns 10.2ms 20.5ms 30.7ms 40.9ms" shows many short span bars cascading diagonally from top left toward the lower middle, with a few longer bars. Below is a span table with a "Span name" header, a "Search spans..." box, collapse and expand buttons, and a timeline axis "0ns 10.2ms 20.5ms 30.7ms 40.9ms". Rows (name, service, duration): root span with collapse toggle "123", "GET /..." "datasette..." 40.9ms spanning the full timeline; then alternating rows where each "db.query" has a collapse toggle "1": db.query datasette-local 679µs, db.query.execute datasette-local 278µs, db.query datasette-local 341µs, db.query.execute datasette-local 55µs, db.query datasette-local 357µs, db.query.execute datasette-local 197µs, db.query datasette-local 330µs, db.query.execute datasette-local 73µs, db.query datasette-local 2.26ms, db.query.execute datasette-local 2.02ms, db.query datasette-local 232µs, db.query.execute datasette-local 64µs, db.query datasette-local 207µs, db.query.execute datasette-local 71µs, db.query datasette-local 6.11ms. The child span bars start progressively later across the early part of the timeline.

Tags: datasette, observability, alex-garcia, opentelemetry

来源:Simon Willison 博客 · simonwillison.net